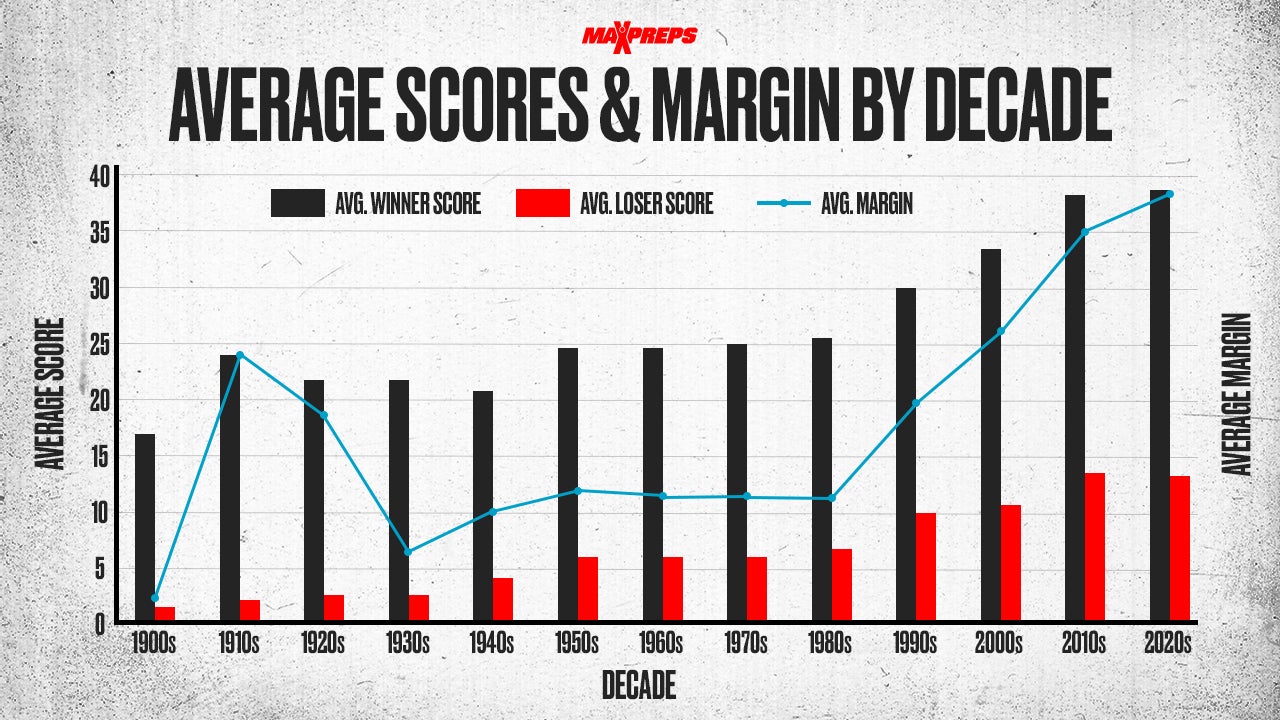
For most of the 20th century, the average winning team scored in the 20s. That figure has climbed to nearly 39 points in the 2020s. The increase has come at the same time as the rise of spread offenses and 4,000-yard passing seasons.
The scoring chart included is based on research by David McKnight of
McKnight's American Football. McKnight has collected scores from 5,217,000 games covering 149 seasons from 1877 through 2025. He used this data to calculate the average winning score, average losing score and average margin for each decade.
(DATA: David McKnight, McKnight's American Football)
The chart shows that scoring has not increased at a steady rate. Average winning scores rose during the 1910s before falling in the 1920s and 1930s.
High school football was still a new sport during the early decades. Some schools had experienced teams while others were just starting programs. There were also fewer classifications based on school size. Those differences produced many lopsided scores.
An early kickoff rule made the problem worse. The team that had been scored upon could choose to kick or receive. An overmatched team might kick in hopes of pinning its opponent deep in its own territory.
That strategy often failed. The stronger team received the ball, drove down the field and scored again. The rule changed during the 1920s, requiring the team that had been scored upon to receive. That made it harder for one team to control the ball for most of the game.
Average winning scores eventually returned to the mid-20s and stayed near that level from the 1950s through the 1980s. Teams relied on run-oriented offenses such as the single-wing, Wing-T, I-formation, wishbone and veer.
Those offenses were built to control the ball and the clock. A scoring drive might take 10 or 12 plays and use five or six minutes. Fewer possessions usually meant fewer points.
The list of quarterbacks with 4,000 passing yards shows how rare big passing seasons were. Jimmy Jordan of
Leon (Tallahassee, Fla.) threw for 4,098 yards in 1975. No other player on the list reached 4,000 until Lupe Rodriguez of
Mission (Texas) did it in 1987.
The 4,000-yard milestone represents the upper end of high school passing. Those exact performances did not cause higher scores, but they reflect the broader rise in passing and scoring.
Four-thousand-yard seasons remained uncommon in the early 1990s. The list has two in 1990, two in 1991 and one each in 1992 and 1993. The total grew to six in 1997, eight in 1998 and seven in 1999.
Average scores rose at the same time. The average winning total climbed from about 25 points in the 1980s to 30 in the 1990s. More teams began using multiple receivers and giving quarterbacks more opportunities to throw.
The change became greater during the 2000s. There were 10 quarterbacks with at least 4,000 yards in 2001, 15 in 2008 and 17 in 2009. The shotgun spread forced defenses to cover the entire field, while no-huddle offenses created more plays and possessions.
Passing totals exploded during the 2010s. The number of 4,000-yard performances doubled from 14 in 2011 to 28 in 2012. It reached 31 in both 2013 and 2014 and peaked at 36 in 2015 and 2019.
The average winning score also reached about 38 points during the decade. Longer playoff schedules, offseason instruction, seven-on-seven competition and better statistical reporting also helped produce more 4,000-yard seasons.
Losing teams are scoring more as well. The average loser scored about six or seven points during much of the middle of the 20th century. That number has climbed to nearly 13 in the 2020s.
However, higher scores have not produced closer games. The average margin was close to 18 points from the 1940s through the 1980s. It has climbed to nearly 26 points in the 2020s.
Scores in the 40s, 50s and 60s have become common. As passing totals have increased, average winning scores have moved from the mid-20s to nearly 40.
