The best record attained by any high school football team is 16-0. In nearly 150 years of the sport, only 177 teams have ever accomplished
the feat. Naturally, we decided to rank every single one of them.
Of
course not every school has the chance to go 16-0. Unless you live in California, Georgia, North Carolina, Ohio, Pennsylvania, Tennessee or Texas, your state doesn't allow for that many
games to be played in a season due to the number of regular season games combined with the size of the playoff brackets.
Southlake Carroll (Southlake, Texas) is the king of 16-0 records. Under
various coaches, the Dragons have posted a 16-0 record eight times. No
other school has more than four. The Dragons also rank as the second and
third best teams to ever post a 16-0 mark.
MaxPreps rated all
177 16-0 teams using the objective MaxPreps ratings for every team that
played after the 2003 season and used enrollment level, total points
scored and quality of opponents to try and rate teams prior to 2003 as
best we could. That aspect of the rankings is subjective.
The
first time a high school football team posted a 16-0 record was in 1925
by
Pine Bluff (Ark.). No other team went 16-0 until
Daingerfield (Texas) pulled it off in 1983 with a spectacular season that saw the Tigers outscore
opponents 631-8. Since then, there has been at least one 16-0 team every
year, including the 2020 COVID season that cut things short for many
states. Rankings listed below include the
MaxPreps single season rating when available.
When it comes to ranking the best 16-0 teams, however, the best one is the first one – the Pine Bluff Zebras of 1925.
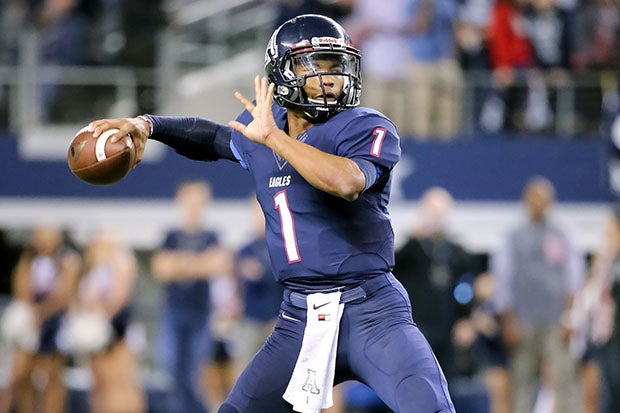
Kyler Murray led Allen (Texas) to 16-0 records in 2013 and 2014. (Photo: Robbie Rakestraw)
Under
coach Foy Hammons, the Zebras were deemed national champions in 1925 by
the National Sports News Service. Pine Bluff outscored opponents 684 to
21. Pine Bluff played opponents from Georgia, Ohio,Tennessee and Texas. According to the Pine Bluff yearbook, the Zebras had 8,118 yards
of offense and gave up 1,779 for an average of 507 yards per game to
111. The team had the leading scorer in the nation in Billy Hicks, who
had 284 points.
2. 2006 Southlake Carroll (Southlake, Texas), 90.7Under
the guidance of head coach Todd Dodge and his son Riley, the Dragons posted their third straight undefeated
season. Riley led the team at quarterback, throwing for 4,237 yards. The
Dragons defeated Westlake for the championship. The Dragons were ranked
No. 1 in the nation by MaxPreps. Riley Dodge is now the head coach at Southlake Carroll.
3. 2005 Southlake Carroll, 88.6Coach
Todd Dodge had a his second straight 16-0 season in 2005, beating Katy
for the championship. Greg McElroy led Class 6A in passing yardage with
4,682 yards. Five different ranking services picked Southlake Carroll
No. 1 in the nation.
4. 2013 St. John Bosco (Bellflower, Calif.), 87.0Under
coach Jason Negro, St. John Bosco earned a national championship nod
from three different ranking services. Josh Rosen, a junior, threw for
3,200 yards to lead the Braves.
5. 2013 Allen (Texas), 85.9Led
by junior quarterback Kyler Murray, Allen defeated Pearland 63-28 for
the Class 6A state championship. Murray threw for 3,669 yards.
6. 1989 Permian (Odessa, Texas), N/AGary
Gaines captured the national championship just two years after Buzz
Bissinger chronicled the 1987 season as part of his book "Friday Night
Lights."
7. 2004 Southlake Carroll, 85.8Todd Dodge posted
his first of three straight 16-0 seasons. Chase Daniel quarterbacked the
team and led Class 6A with 4,617 yards passing.
8. 1987 Plano (Texas), N/AQuarterback
Steve Needham rushed for 1,548 yards and passed for 1,299 yards in
leading Plano to the mythical national championship.
9. 1991 Permian, N/AGaines
was no longer the coach, but the tradition remained the same for the
Panthers under coach Tam Hollingshead. Permian finished No. 2 in the
national rankings.
10. 2006 Cedar Hill (Texas), 83.1The
Longhorns finished No. 2 in the national rankings behind Southlake
Carroll after winning a state championship with a 51-17 win over Cypress
Falls.
Best of the rest of the 16-0 teams
11. 2015
Katy (Texas), 82.4
12. 2014
Folsom (Calif.), 80.2
13. 2021
Westlake (Austin, Texas), 79.9
14. 2002
Independence (Charlotte, N.C.), N/A
15. 1998
Richmond (Rockingham, N.C.), N/A
16. 1994
Tyler (Texas), N/A
17. 1985
Yates (Houston, Texas), N/A
18. 2007
Katy (Texas), 79.6
19. 2014 Allen, 78.8 1
20. 2004
Central Catholic (Pittsburgh, Pa.) 78.3
21. 2000 Katy, N/A
22. 2002 Southlake Carroll, N/A
23. 1995 Roosevelt (San Antonio), N/A
24. 1996
Westlake (Austin, Texas), N/A
25. 1994
Stephenville (Texas), N/A
26. 2011
Lake Travis (Austin, Texas), 78
27. 2018
North Shore (Houston, Texas), 78
28. 2012
North Allegheny (Wexford, Pa.), 76.7
29. 2006
Upper St. Clair (Upper St. Clair, Pa.), 76.1
30. 2001
Independence (Charlotte, N.C.), N/A
31. 2011 Southlake Carroll, 75.8
32. 1999 Stephenville, 17, N/A
33. 2010
Pearland (Texas), 75.6
34. 2008 Lake Travis, 75.6
35. 1993 Stephenville, N/A
36. 1992
Waxahachie (Texas), N/A
37. 2009 Lake Travis, 74.9
38. 2003
La Marque (Texas), 74.5
39. 2016
DeSoto (Texas), 74.4
40. 2015
Mission Viejo (Calif.), 74.2
41. 2017 Folsom, 73.9
42. 2007 Central Catholic (Pittsburgh), 73.9
43. 2013
Aledo (Texas), 73.2
44. 2017 Allen, 73
45. 2012 Katy, 72.4
46. 2003 Independence, 72
47. 1984
Denison (Texas), N/A
48. 1983
Daingerfield (Texas), N/A
49. 2001
Ennis (Texas), N/A
50. 2017
Pine-Richland (Gibsonia, Pa.), 70.8
51. 2004
Kilgore (Texas), 70.5
52. 1992 Southlake Carroll, N/A
53. 1995
Sealy (Texas), N/A
54. 1995 La Marque, N/A
55. 2001
Celina (Texas), N/A
56. 1993 Southlake Carroll, N/A
57. 2015
George Ranch (Richmond, Texas), 70.4
58. 2005
Hebron (Carrollton, Texas), 70.4
59. 2019
Corona del Mar (Newport Beach, Calif.), 70.2
60. 2012
Navasota (Texas), 70
61. 2007 Celina, 69.3
62. 2010 Aledo, 69.2
63. 2018
Longview (Texas), 68.4
64. 2013
Mallard Creek (Charlotte, N.C.), 68
65. 2005 Celina, 67.3
66. 2013
Argyle (Texas), 67.1
67. 2018 Aledo, 67
68. 1985 Daingerfield, N/A
69. 1987
Cuero (Texas), N/A
70. 1988 Southlake Carroll, N/A
71. 1990
Vernon (Texas), N/A
72. 1994 Sealy, N/A
73. 2019
Shadow Creek (Pearland, Texas), 66.7
74. 2010
Allentown Central Catholic (Allentown, Pa.), 66.1
75. 2009
Selinsgrove (Pa.), 66.1
76. 2007
Thomas Jefferson (Jefferson Hills, Pa.), 66
77. 2010
Butler (Matthews, N.C.), 65
78. 2007
Jeannette (Pa.), 65
79. 2020 Argyle, 64.8
80. 2000 Celina, N/A
81. 1999
Commerce (Texas), N/A
82. 1997 Sealy, NA
83. 1984
Medina Valley (Castroville, Texas), N/A
84. 1998
Carver (Winston-Salem, N.C.), N/A
85. 2015
Cedar Park (Texas), 64.8
86. 2016 Aledo, 64.4
87. 2021
China Spring (Texas), 64.3
88. 2018
Highland Park (Dallas), 64.3
89. 2021
Oakland (Murfreesboro, Tenn.), 63.8
90. 2016
West Orange-Stark (Orange, Texas), 62.9
91. 2014
Gilmer (Texas), 62.9
92. 2015
Central Catholic (Modesto, Calif.), 62.4
93. 2019
Carthage (Texas), 62.2
94. 1999 Celina, N/A
95. 1991
Schulenburg (Texas), N/A
96. 1986
Shiner (Texas), N/A
97. 1989
Groveton (Texas), N/A
98. 2009 Carthage, 62.2
99. 2013
South Fayette (McDonald, Pa.), 61.9
100. 2006
Wilson Area (Easton, Pa.), 61.8
101. 2006 Independence, 61.4
102. 2017 Carthage, 61.4
103. 1997
Stanton (Texas), N/A
104. 1996
Iraan (Texas), N/A
105. 1990 Groveton, NA
106. 2005
South Park (Pa.), 60.8
107. 2019
Weddington (Matthews, N.C.), 59.7
108. 2014
New Bern (N.C.), 58.5
109. 2019
Southern Columbia Area (Catawissa, Pa.), 58.3
110. 2014
Campolindo (Moraga, Calif.), 58.2
111. 2003
Garrison (Texas), 58.2
112. 2019 Thomas Jefferson (Jefferson Hills, Pa.), 57.9
113. 2021
Chardon (Ohio), 57.8
114. 2011
Clairton (Pa.), 57.8
115. 2015
Canadian (Texas), 57.8
116. 2021 Stephenville, 57.7
117. 2014 Navasota, 57.7
118. 2017
Pleasant Grove (Texarkana, Texas), 57.5
119. 2012 Clairton, 57.3
120. 1994
Thorndale (Texas), N/A
121. 1984
Munday (Texas), N/A
122. 1998
Tenaha (Texas), N/A
123. 2000
Stratford (Texas), N/A
124. 2016
Wake Forest (N.C.), 57.2
125. 2015
La Vega (Waco, Texas), 56.6
126. 2012
Wyomissing (Pa.), 56.4
127. 2006 Southern Columbia Area, 56.3
128. 2007
Western Alamance (Elon, N.C.), 56.2
129. 2011
Lancaster Catholic (Lancaster, Pa.), 56.2
130. 2017
Charlotte Catholic (Charlotte, N.C.), 56
131. 2005
J.H. Rose (Greenville, N.C.), 55.9
132. 2014 South Fayette, 55.9
133. 2015
Brock (Texas), 55.5
134. 2005 Charlotte Catholic, 55.3
135. 2017 Southern Columbia Area, 55.2
136. 2013
Cisco (Texas), 55.1
137. 2010 Clairton, 54.4
138. 2006 J.H. Rose, 54.3
139. 2010
Hillside (Durham, N.C.), 54
140. 2021
Franklin (Texas), 54
141. 2008
Dudley (Greensboro, N.C.), 53.8
142. 2018
Penn Hills (Pittsburgh, Pa.), 53.1
143. 2015
Crest (Shelby, N.C.), 53
144. 2003
Southwest Onslow (Jacksonville, N.C.), 52.8
145. 2010
West Rowan (Mt. Ulla, N.C.), 52.6
146. 2011
Havelock (N.C.), 52.5
147. 2008
Steelton-Highspire (Steelton, Pa.), 52.4
148. 2013
North Catholic (Cranberry Township, Pa.), 52
149. 2009 West Rowan, 50.7
150. 2018 Southern Columbia Area, 50.6
151. 2007
Reidsville (N.C.), 49.7
152. 2014 Crest, 49.6
153. 2013 Havelock, 49.4
154. 2006
Shelby (N.C.), 48.4
155. 2016 Shelby, 48.3
156. 2015
Monroe (N.C.), 48.1
157. 2021
Marion Local (Maria Stein, Ohio), 47.4
158. 2017
Hibriten (Lenoir, N.C.), 47
159. 2007 Kenan (N.C.), 47
160. 2015
Bishop Guilfoyle (Altoona, Pa.), 46.8
161. 2008 Reidsville, 46.6
162. 2014 Bishop Guilfoyle, 46.3
163. 2005
Thomasville (N.C.), 45.7
164. 2015 Southern Columbia Area, 45.4
165. 2010
Tarboro (N.C.), 45.1
166. 2016 Reidsville, 42.5
167. 2008 Thomasville, 41.7
168. 2006 Thomasville, 41.4
169. 2008
Mount Airy (N.C.), 40.3
170. 2014
East Lincoln (Denver, N.C.), 40
171. 2004 Charlotte Catholic, 39.9
172. 2009
Albemarle (N.C.), 39.8
173. 2003
Elkin (N.C.), 38.7
174. 2003 Albemarle, 37.8
175. 2018 Reidsville, 37.3
176. 2011
West Stokes (King, N.C.), 36.6
177. 2007
Plymouth (N.C.), 35.7
178. 2010
Wallace-Rose Hill (Teachey, N.C.), 35.4
179. 2012 East Lincoln, 34.6